In early May 2025 Rui Seabra, a Portuguese marine biologist and National Geographic Explorer, came to visit.
Rui studies how temperature fluctuates in rocky shores at both small and large scale. He is the co-leader of the CCTBON research project, which is implementing a network aimed at monitoring rocky shore temperatures and biodiversity patterns at over 400 sites across the entire Atlantic.
Rocky shores are among the most thermally dynamic environments on Earth, but their thermal and biodiversity patterns remain poorly understood at continental and decade level scale. This negatively impacts our ability to understand the link between temperature and biodiversity within the context of Global Warming.
Their project is using state-of-the-art, temperature loggers designed by their group, and streamlined biodiversity survey procedures.
The data gathered will allow analysis of the link between temperature and biodiversity at an unprecedented level of detail and spatial scope – creating the largest sustained temperature and biodiversity observation network of its kind in the entire globe.
All data outputs will be made fully available to the public, and citizen science opportunities will be encouraged.
Our temperature loggers
The temperature loggers are small in size and the shape of a bottle top, but they are mighty in their abilities.
They take a temperature reading every hour, on the hour, and they will continue to do this for 15 years.
They use a similar approach to bank cards, in that they take a little battery when briefly tapped by a phone to allow their data to be gathered.
Our logger locations
We selected three locations around the Forth where we thought we would get useful comparative data and where we have amazing community groups who can support this citizen science project.
The locations are Cramond in Edinburgh, Lower Largo in Fife and North Berwick in East Lothian.
Installation
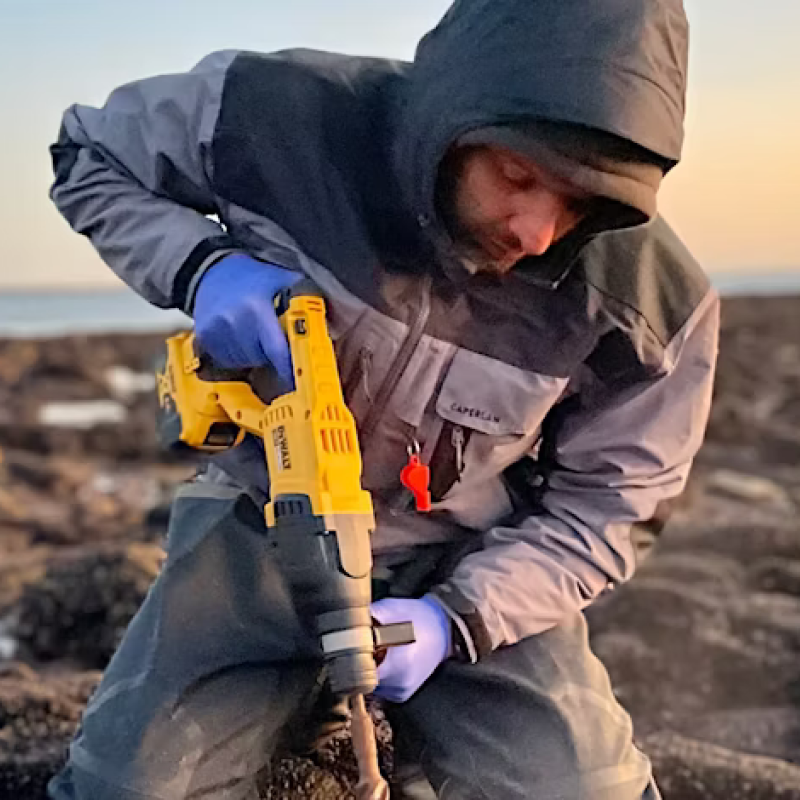
Over a sunny weekend in May 2025 we installed the loggers at each location with Rui’s help and great community interest and support.
Small bottle top sized holes were drilled into selected rock or concrete, with NatureScot permission. A logger was fitted into the hole and then covered with resin to protect them from storms and strong waves.
Each site has a number of loggers installed, some in more shaded areas and some in sunny areas – giving us ‘cold logger’ and ‘hot logger’ readings.
Then we left the loggers alone to do their job.
Citizen Science Learning
While he was with us Rui trained us how to install the loggers, how to capture the stored data and how to send it to the CCTBON project where it will be analysed. We will then be sent feedback about our site, comparisons across Scotland and comparisons across the wider Atlantic Ocean.
We also learned how to monitor rocky shore biodiversity in the vicinity of the data loggers to allow analysis of the link between temperature and biodiversity – exciting times ahead as we begin to understand what this means.
What temperature readings are we seeing so far?
Our commitment is to visit each location once per quarter to gather readings from the loggers and we have now been in August and November.
Readings are very similar at the three sites, and all clearly show the extreme variation that our local biodiversity has to handle.
Cold loggers show a temperature range between around 2 and 20 degrees, and hot loggers range between 2 and 35 degrees in Lower Largo and Cramond, and as high as 40 degrees at North Berwick!